ref: http://rnduja.github.io/2015/10/07/deep_learning_with_torch_step_4_nngraph/
doc: https://github.com/torch/nngraph/
The aim of this library is to provide users of nn package with tools to easily create complicated architectures.
luarocks install nngraph
optionally can install graphvis for graph visualization.
From previous posts, to build networks, there are 2 important classes:
Moduleas a nn layer, can do forward and backward propContainerto combine severalModules
The nngraph library provides a way to build any complex network focusing on the network graph and avoiding the use of Containers.
nngraph.Node
Any Module can be wrapped into a nngraph.Node.
For all nn.Module, nngraph overrides the __call__ meta method (the function call operator ()), by calling a module, a Node is returned:
th> require 'nngraph';
                                                                      [0.0000s]
th> module = nn.Identity()
                                                                      [0.0001s]
th> module
nn.Identity
                                                                      [0.0000s]
th> module()
nngraph.Node
                                                                      [0.0000s]
The arguments of __call__ are other (parent) nodes that come into this node, in this way we specify which module(s) will feed into the current node/module:
th> h1 = nn.Linear(20, 10)()
                                                                      [0.0001s]
th> h2 = nn.Linear(10, 1)(h1) -- h1 is input of h2
                                                                      [0.0001s]
Simple sequential example
We make a network by calling nn.gModulet(), this takes 2 arguments: a table of inputs, and a table of outputs:
th> mlp = nn.gModule({h1}, {h2})
                                                                      [0.0002s]
Then we can plot the model using graphviz:
-- draw graph (the forward graph, '.fg'), use it with itorch notebook
graph.dot(model.fg, 'MLP')
-- or save graph to file MLP.svg and MLP.dot
graph.dot(model.fg, 'MLP', 'MLP')
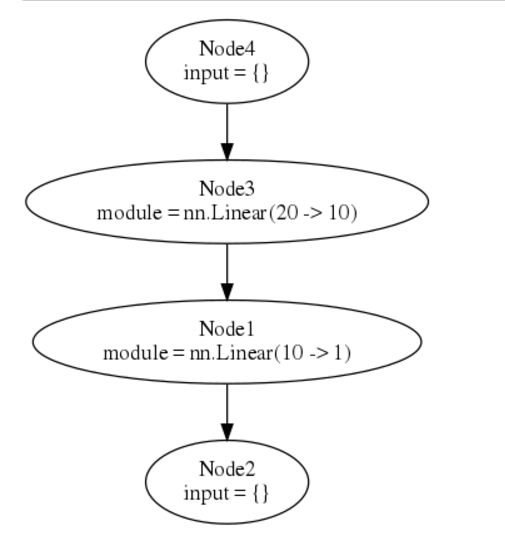
(The first and last nodes are dummy nodes and regroup all inputs and outputs of the graph.)
DAG example
https://github.com/torch/nngraph#a-network-with-2-inputs-and-2-outputs
Here is an example to build a model with 2 inputs and 2 outputs:
h1 = nn.Linear(20, 20)()
h2 = nn.Linear(10, 10)()
hh1 = nn.Linear(20, 1)(nn.Tanh()(h1))
hh2 = nn.Linear(10, 1)(nn.Tanh()(h2))
madd = nn.CAddTable()({hh1, hh2})
oA = nn.Sigmoid()(madd)
oB = nn.Tanh()(madd)
gmod = nn.gModule({h1, h2}, {oA, oB})

x1 = torch.rand(20)
x2 = torch.rand(10)

gmod:updateOutput({x1, x2})
gmod:updateGradInput({x1, x2}, {torch.rand(1), torch.rand(1)})
graph.dot(gmod.fg, 'Big MLP')
alternatively, use - to make your code looks like the data flow:
h1 = - nn.Linear(20,20)
h2 = - nn.Linear(10,10)
hh1 = h1 - nn.Tanh() - nn.Linear(20,1)
hh2 = h2 - nn.Tanh() - nn.Linear(10,1)
madd = {hh1,hh2} - nn.CAddTable()
oA = madd - nn.Sigmoid()
oB = madd - nn.Tanh()
gmod = nn.gModule( {h1,h2}, {oA,oB} )
Annotations of nodes
https://github.com/torch/nngraph#annotations
Use node::annotate() to annotated nodes, can add name/description, or change node color.
WIth annotation, can enable debugging too:
Disqus 留言